In our previous posts,
we walked through the process of configuring various low-level container
runtimes in Knative using the RuntimeClass feature of K8s. We
detailed the setup for
isolation mechanisms like
gVisor, with a special
focus on Kata and its associated hypervisors, including AWS
Firecracker and
QEMU. Additionally, we
delved into the capabilities of unikernels, showcasing the
power of urunc in the serverless realm.
Now, you might be wondering: What’s the real advantage beyond ensuring the security isolation of workloads? Why choose one mechanism over another? And why even dive into this conversation?
This post aims to provide insights into these questions, shedding light on the considerations and factors at play in the dynamic landscape of low-level container runtimes for Knative workloads.
Overview Link to heading
Despite achieving security isolation through sandboxed container runtimes like Kata-containers or gVisor, it is crucial to acknowledge that running containerized workloads in a VM, isolated from the host kernel, can introduce significant overhead to the final execution. In serverless architectures, where the cost of a function is directly tied to deployment time, this factor becomes a key consideration.
Moreover, optimizing the use of hardware resources by activating them only when necessary contributes to a ‘greener’ cloud solution, reducing Software Carbon Intensity. Conventional practices, like booting an entire OS and unnecessary libraries, can be counterproductive in terms of software stack complexity and performance. To this end, we try to combine isolated execution of user-workloads with optimal resource utilization and performance efficiency in a serverless context.
To validate the above hypothesis we present an initial, high-level performance analysis of Knative using:
- generic container runtimes (
runc) - sandboxed container runtimes (
kata-containers,gVisor) urunc, our own unikernel container runtime
We base our measurements on our own
modified version of
kperf.
Our primary focus revolved around examining function-spawning latency,
response time, and scalability. To achieve this, we developed
scripts utilizing kperf to specifically measure these aspects. Below, we showcase
two experiments conducted using kperf.
- The initial set of measurements pertain to “cold-start” latencies, representing the duration required for a function to spawn and respond to a request.
- The second set, illustrates average latencies when concurrently spawning multiple services.
By presenting these findings, our aim is to provide users with critical metrics that aid in selecting the most efficient low-level container runtime, optimizing their serverless workload performance.
NOTE: kperf development was stale for a while and Sep 15th the maintainers archived the
repo, focusing on a different
approach for
benchmarking Knative. We plan to gather metrics related to container runtimes
with this tool as well.
Architecture overview Link to heading
Figure 1: Knative Serving stock components and workflow.
Figure 1 depicts a typical Knative setup on a k8s cluster. Boxes in light
blue show the Knative components, while the ingress controller is assumed to
be provided by the infrastructure. Since Knative function pods are
essentially containers, cloud vendors refrain from serving multiple tenants on
shared hardware due the limitations this technology imposes on isolating user
workloads. Consequently, these vendors opt to offer dedicated bare-metal or
virtualized infrastructure specifically for serverless tenants.
A solution to the issue above, could be to sandbox the user workload (the Serverless Function) in an enclave that protects the host (and the rest of the tenants) from potentially malicious code. Figure 2 shows an alternative setup to the default, where the function pods are being spawned using sandboxed container runtimes such as kata-containers (left) and gVisor (right).
Figure 2: Knative Serving with sandboxed container runtimes.
This mechanism has merits and shortcomings:
cons:
- the sandbox spawn is on the critical path (slower cold boot times)
- the code executing in the user-container runs virtualized (no straightforward access to hardware accelerators)
pros:
- the code executing in the user-container runs virtualized: it is much harder for malicious user code to escape to the host and/or access sensitive data from the system or other co-located tenants.
User workloads Link to heading
Another point of discussion is the type of workloads in a typical serverless setup. What do users run, or better, how complicated is the code that users run in a common serverless application?
Unikernels have come a long way since their inception several years ago, where they showed great potential (e.g. millisecond boot times, ultra low OS memory consumption) but were difficult to use, hard to debug or limited in functionality. Today, with the advent of approaches to run unmodified Linux binaries as unikernels, or automate the building process they seem ready for prime time.
In an effort to combine the isolation characteristics of virtualization /
sandboxed container runtimes and the lightweight nature of unikernels, we couple
unikernels and containers with urunc
and deploy Knative functions on top of that, bringing the system management
overhead for a secure, isolated, and efficient serverless deployment to the
bare minimum.
To validate our assumptions, we measure end-to-end service latencies across various
container runtimes, including: generic, gvisor, kata-qemu, kata-fc, kata-rs, kata-clh,
and urunc.
We assume the bare minimum in terms of application (user-container), a simple HTTP reply program written in go for the generic and sandboxed functions and in C for the unikernel function.
The individual steps that comprise the service latency measured are shown below:
kperfissues the request that reaches the ingress controller- the request traverses the networking stack of k8s and reaches the
activator - the
activatortriggers the deployment of a function pod - upon the creation of the function pod, the request reaches
queue-proxy queue-proxyforwards the request to theuser-container,- the
user-containerreplies tokperf.
Figure 4 visualizes these steps in a sequence diagram, presenting which components interact with each other, as well as the time spent at each part for the flow.
Figure 4: End-to-end request servicing on Knative (cold instantiation).
In what follows, we briefly describe the hardware and software components that comprise our experimental setup, and present the measurements we captured.
Experimental testbed Link to heading
For our measurements, we use a bare metal server from Hetzner with 32 physical cores and 128GB RAM. Detailed specifications are shown in the table below:
| CPU | Memory | Storage | Network | OS |
|---|---|---|---|---|
| AMD EPYC 7502P “Rome” (32 Cores) Zen2 | 4 x 32 GB DDR4 ECC | 960 GB NVMe SSD Datacenter Edition | Internal (single server setup) | Ubuntu 22.04.3 LTS (jammy) |
The software stack we use for our tests is focused around the requirements for
a generic k8s plus Knative setup, along with the sandboxed container runtimes and urunc.
Detailed components and versions are shown in the table below:
| Linux | runc | containerd | nerdctl | kubelet | calico | kata-containers | kperf | Knative serving |
|---|---|---|---|---|---|---|---|---|
| v5.15.0 | v1.1.9 | v1.7.5 | v0.20.0 | v1.28.2 | v3.26.0 | v3.2.0 | v20231115-78dabcb | v1.12.0 |
To enhance kperf, we initiated a tailored development process by forking and constructing our
unique iteration. Among the fundamental modifications crucial for efficient result collection was
the redirection
of GET requests to the ingress controller with the appropriate headers
and the implementation of timeouts inserted specifically for clients.
This was imperative to alleviate the issue of non-responsive services caused by
hardware constraints, notably the burden of spawning an excessive number of services.
With these modifications implemented, we effectively utilized kperf’s scale
command to gather latency statistics for both single-service function instances
and multiple services spawned simultaneously.
Moreover, the incorporation of a helper
script
facilitated an automated
process for retrieving this data and dynamically adjusting the low-level
runtime of workloads as well as the number of concurrently
spawned services.
Furthermore, we undertook another aspect of our work aimed at enhancing the accuracy of retrieved metrics. This involved disabling the CPU frequency scaler, responsible for dynamically modifying the CPU cores’ frequency.
1cpupower frequency-set --governor performance
By disable frequency scaling, we are essentially ensuring that the CPU operates at a constant frequency leading to more stable and accurate metric retrieval.
At the same time, limiting the CPU cores’ turbo feature, allows us to capture reproducible metrics.
1echo "0" | sudo tee /sys/devices/system/cpu/cpufreq/boost
Evaluation Link to heading
We plot our findings and present an initial analysis of Knative performance over the various container runtimes we consider for our tests.
Service Response Latency (single instance) Link to heading
We first test the total time needed for a single request to reach a defined,
but not provisioned, Knative service. Essentially, this metric represents how
much time the user will wait for a service when they first access it. Usually,
the dominating part of this time is the cold-boot time of the function.
| Parameter name | Value | Metric | Description |
|---|---|---|---|
timeout | 3 | sec | Duration to wait for Knative Service to be ready |
time-interval | 90 | sec | The time interval of each scale up |
iterations | 30 | - | nr of consecutive runs of the same test |
scale-client-timeout | 100 | sec | time to give up on the operation (non-responsive service) |
stable-window | 25 | sec | “time window over which metrics are averaged to provide the input for scaling decisions” |
kperf reports this metric as Service Response Latency. The parameters we
used for setting up kperf are shown in the table above.
| Service Latency | Average | Minimum | Maximum |
|---|---|---|---|
| generic | 1.20 | 0.92 | 1.23 |
| gvisor | 2.21 | 2.15 | 2.23 |
| kata-qemu | 2.21 | 2.10 | 2.23 |
| kata-fc | 2.21 | 2.21 | 2.22 |
| urunc | 1.21 | 1.19 | 1.23 |
The table above, summarizes the absolute service latency for the various container runtimes in our test. We plot these results in Figure 4.

Figure 4: Service Response Latency as a function of the various container runtimes.
Figure 4 depicts the service response latency for the sandboxed container
runtimes and urunc. The horizontal lines show the average response latency,
while the vertical lines depict the minimum (lower) and maximum (higher)
response latency captured during our test.
An expected observation in Figure 4 is that the sandboxed container runtimes require 2-2.5 seconds for servicing a request. The parameters for each one vary depending on the sandbox technology used, but on average a request will be served in approximately 2.21 seconds.
Moreover, using the generic container runtime, we see that a request is being served in approximately 1.20 seconds.
Additionally, Figure 4 shows that the behavior of urunc is on par with the generic
container runtime (runc). The performance of our early version of urunc is
comparable to runc (~1.21s on average vs 1.20s for runc).
Finally, the maximum service request latency for runc and urunc do not
exceed 5% of the total latency.
Figure 5 plots the 99th percentile of Service latency for the various runtimes,
proving that urunc can sustain low latency even for slower requests.
Figure 5: Service Response Latency for the 99th percentile as a function of the various container runtimes.
The takeaway message from Figures 4 and 5 is that unikernels can achieve the same or (yet to be proven) better performance than generic containers when it comes to serverless functions!
Concurrent servicing (multiple instances) Link to heading
In this test we want to assess the footprint and responsiveness of a Knative
service by scaling to a large number of instances.
| Parameter name | Value | Metric | Description |
|---|---|---|---|
timeout | 3 | sec | Duration to wait for Knative Service to be ready |
time-interval | 95 | sec | The time interval of each scale up |
iterations | 15 | - | nr of consecutive runs of the same test |
scale-client-timeout | 120 | sec | time to give up on the operation (non-responsive service) |
stable-window | 300 | sec | “time window over which metrics are averaged to provide the input for scaling decisions” |
The parameters we used for setting up kperf can be found in the table above.
One distinction in the parameters for the single-instance scale metrics involves the extension of the stable-window duration. This extension ensures an extended lifespan for functions/pods, thereby guaranteeing that the required number of services remains concurrently operational.
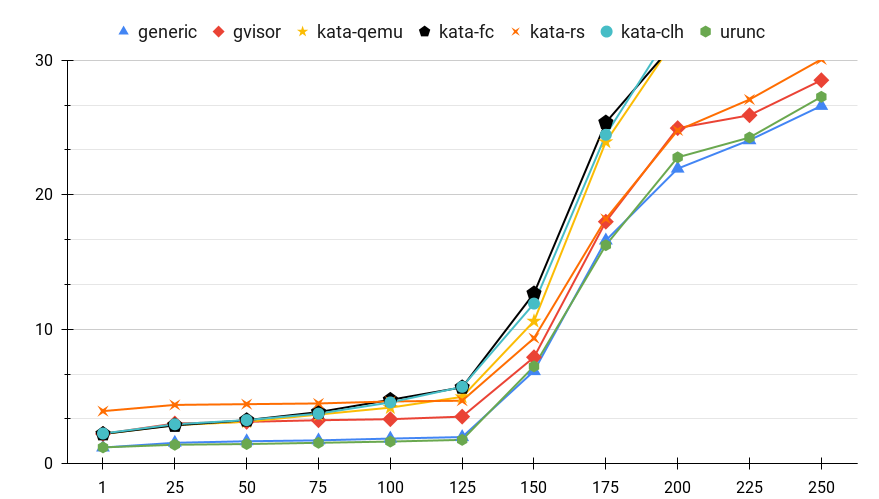
Figure 5: Service Response Latency for various container runtimes when servicing multiple parallel requests.
Figure 5 presents the average service response latency (sec) for each container runtime as a function of the number of concurrent instances of the service. From this figure, some interesting conclusions can be drawn:
generic,gvisor, anduruncexhibit similar behavior when increasing the number of instancesuruncandgenericappear identical in terms of response latency even when scaling to 250 services.gvisorexhibits approximately an average of +1.5sec latency compared tourunc. This accounts for 2x the latency for instances up to 125.kata-*’s overhead ranges from 2x to 3x latency compared touruncup to 125 instances and approximately 1.5x for more instances.
Although the target number of services is defined, some of the instances did not manage to produce a response after 125. Figure 6 summarizes how many actual instances responded in our test for the various runtimes.
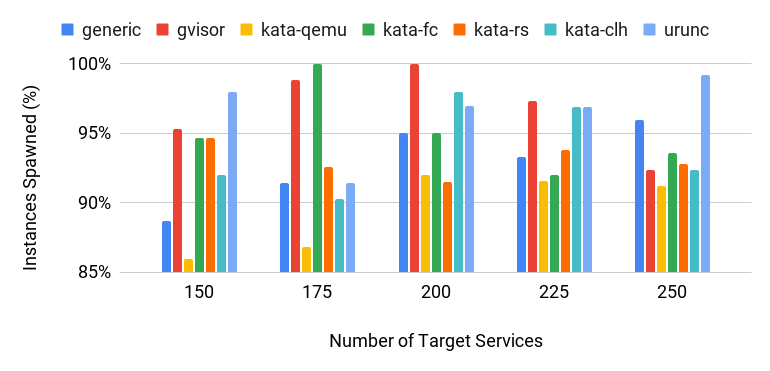
Figure 6: Number of Instances spawned for various container runtimes as a function of the target services requested.
Pushing the scaling limits Link to heading
To explore the maximum amount of services supported on the testbed hardware, we increase the number of services to 500 for urunc and capture:
- the number of actual services spawned
- the service response latency in this context.
We compare these results with the generic container runtime.
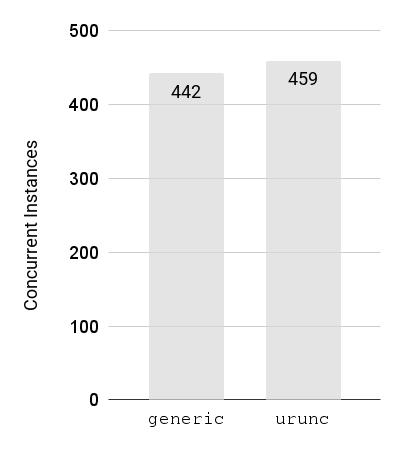
Figure 7: Number of Instances spawned (target 500) for various container runtimes (higher is better).
Figure 7 plots the number of spawned instances for the generic container
runtime and urunc with a target of 500. The achievable number for each
container runtime is shown in the plot. We can see that urunc is able to
spawn as much instances as runc, enabling the sandboxing of user code without
imposing any additional overhead in terms of memory / CPU footprint.
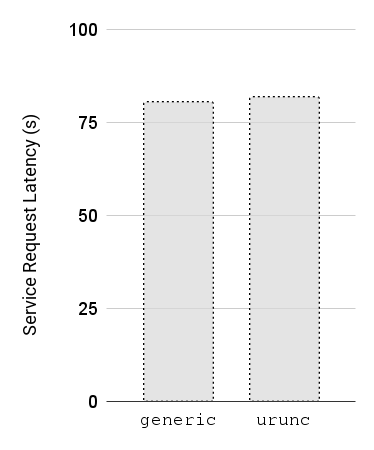
Figure 7: Service Response Latency for multiple concurrent instances (500) for various container runtimes (lower is better).
To validate that the services are responsive and to assess the latency imposed
by so many services running at the same time, we plot the Average response
latency for these services. Figure 7 shows that urunc is able to sustain low
response latency compared to the generic container runtime, even with ~450
instances running.
Conclusions and next steps Link to heading
In this post, we went through an initial evaluation of container runtimes that
sandbox the user code in a serverless environment such as Knative. We presented
the rationale of sandboxing serverless functions, following up from our
previous posts regarding alternative container runtimes for
Knative and urunc, our own container runtime for unikernels.
Isolating the user code from the platform allows cloud vendors to better utilize their infrastructure and enables users to share infrastructure without compromising their isolation requirements. Especially in the context of serverless computing, unikernels seem like a great fit, combining the isolation principles of Virtual Machines, without the overhead and management burden of generic, full virtualization stacks.
There are still a few ways to go for the wider adoption of unikernels, but still, we are working towards this direction and, hopefully, we get to see unikernels in production soon!
Our plan is to continue de-mystifying quirks and issues with serverless platforms and focus on evaluating our approach on devices with lower compute capabilities, as well as add hardware acceleration to the mix!